Section 01
PMI is one cost of buying now. Rent is one cost of waiting. To know which path costs more, you still need to compare the full housing costs on both sides.
PMI feels like a cost you’re choosing to accept. Waiting feels free. Neither assumption holds up once you actually run the numbers side by side.
Section 02
The Two Paths, Defined
Say you’re deciding between two options on a $300,000 home. Path A: buy now with 5% down, or $15,000, and pay PMI until it can be canceled or terminated under the applicable loan requirements. Path B: keep renting and saving until you’ve built enough cash for a 20% down payment, or $60,000 on a $300,000 home. That’s a $45,000 gap from the 5% down payment in Path A.
Both paths can lead to homeownership, but they come with different costs and risks along the way.
Section 03
What Waiting Actually Costs
This is the part that rarely gets calculated. While you’re saving that extra $45,000, you’re still paying for housing without building equity in the property you’re considering buying.
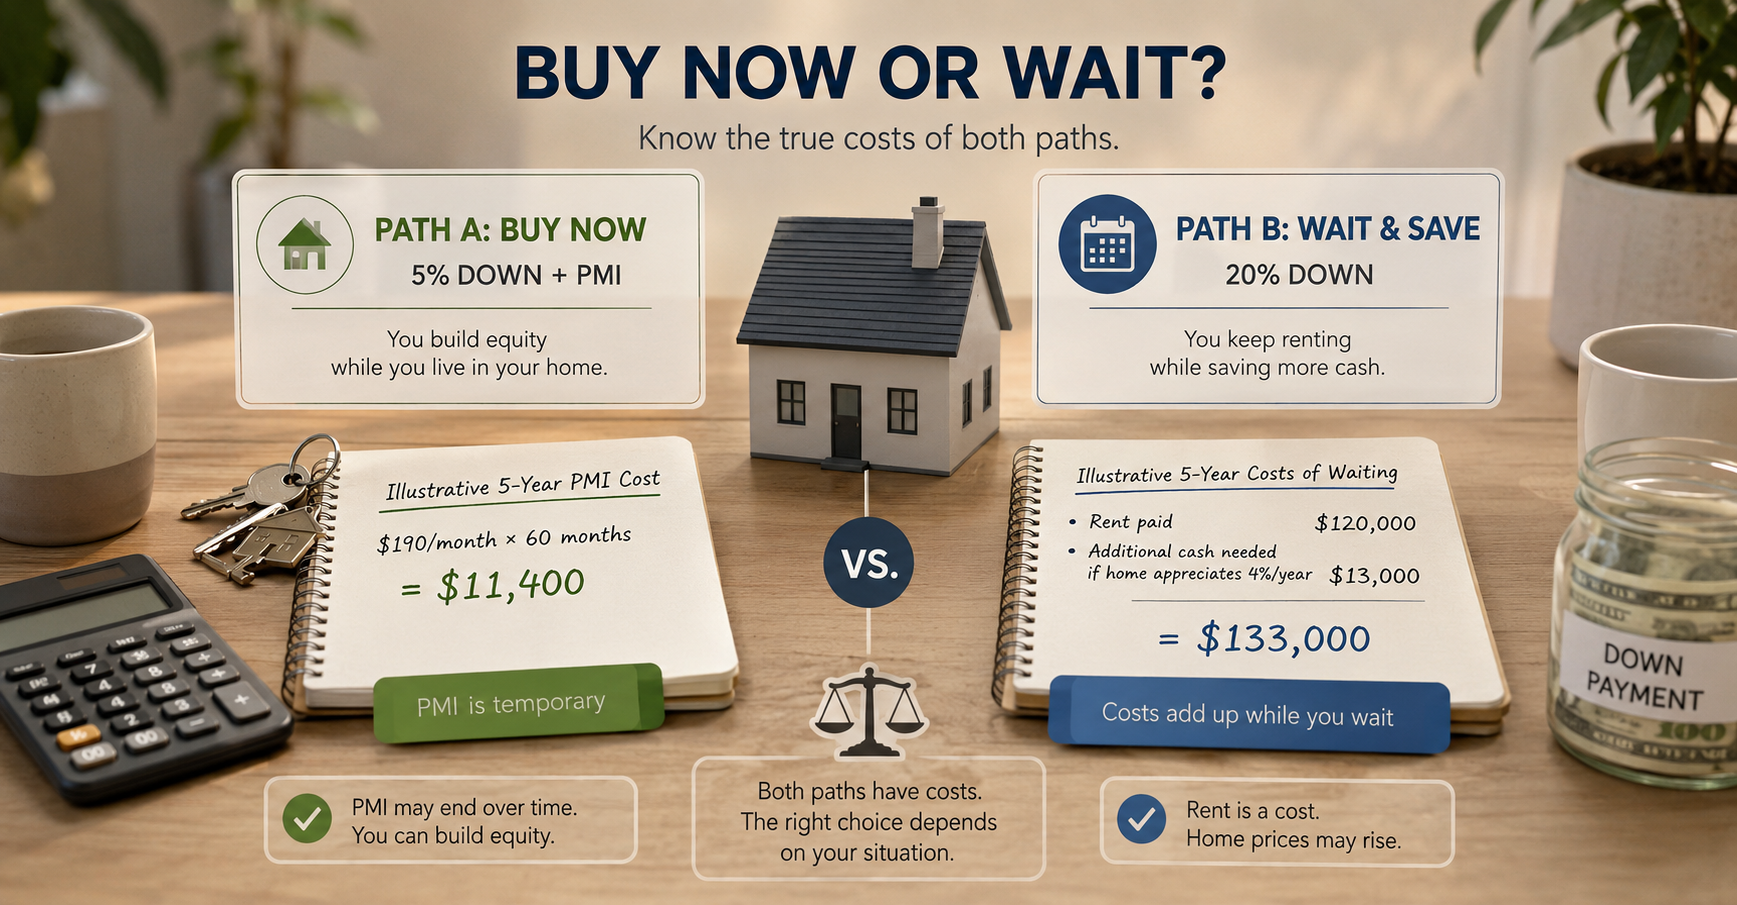
Say you’re renting at $2,000 a month and saving an extra $750 a month toward the original $45,000 gap. At that pace, it would take five years to save the $45,000. But that is only the starting gap. If home prices rise while you wait, the amount needed for a 20% down payment can increase as well.
| Illustrative Amounts to Consider While Waiting | Amount Over 5 Years |
|---|---|
| Rent paid | $120,000 |
| Additional cash needed to reach 20% down if the home appreciates 4% annually | $13,000 |
At 4% annual appreciation, the $300,000 home would be worth about $365,000 after five years. A 20% down payment on that future price would be about $73,000, or roughly $13,000 more than today’s $60,000 target. In other words, the original $45,000 savings gap could become larger if the home’s value rises while you wait.
Home-price appreciation can widen the gap. If the home rises in value while you save, 20% of the future price will be higher than 20% of today’s $300,000 price. That means your cash target for a 20% down payment may increase while you’re saving.
These figures are illustrative estimates based on assumed rent and home-price appreciation. Actual costs and home values vary by market and individual circumstances. This example is for educational purposes only and does not constitute an offer of credit or investment advice.
Section 04
What PMI Actually Costs
Now compare that with one of the costs associated with buying the home today. For illustration, assume PMI of $190 per month on a $285,000 loan. PMI is not a fixed cost for every borrower. Actual PMI costs vary based on the loan, borrower, and other applicable factors.
| PMI Cost | Amount Over 5 Years |
|---|---|
| $190/month × 60 months | $11,400 |
That’s the illustrative PMI cost if it were paid for the full five-year period. In practice, PMI may end earlier or later depending on the loan and applicable requirements. A portion of your mortgage payments may also go toward principal, which can increase your equity over time, assuming other factors remain unchanged. Other ownership costs, such as interest, taxes, insurance, and maintenance, are not included in this comparison.
This is an illustrative estimate only. Actual PMI costs and cancellation or termination timelines vary based on the loan and applicable requirements. This example does not constitute an offer of credit.
Section 05
The Key Costs Side by Side
Put the key costs side by side, and the difference looks significant:
| Path | Illustrative Costs Considered |
|---|---|
| Buy now | $11,400 assumed PMI, plus mortgage interest, taxes, insurance, maintenance, closing costs and other ownership costs. |
| Wait | $120,000 assumed rent, plus possible changes in home price and the down-payment target. |
| What this shows | Both paths carry costs; this table does not determine which path is cheaper. |
This is not a total cost comparison. It highlights selected costs associated with buying now versus waiting. Buying includes costs beyond PMI, while waiting includes rent and potential changes in home prices and the down-payment target.
These figures are illustrative estimates only, based on assumed rent, appreciation, and PMI figures. Actual results depend on your specific market, rent, and loan terms, and do not constitute an offer of credit or investment advice.
Section 06
When Waiting Actually Does Win
This comparison does not point to one right answer. In some situations, waiting may make more sense.
You’re not paying rent while you save. If you’re living with family or have very low housing costs while saving, the housing cost of waiting becomes much smaller. Waiting may make more sense when your housing costs are low while you save.
Your market is flat or declining. The additional cash needed to reach a 20% down payment depends partly on how home prices change while you wait. If prices stay flat or decline, you may not need as much additional cash to reach a 20% down payment as you would in a rising market.
You can close the gap fast. If you can close the $45,000 gap quickly, you’ll pay less rent and face less home-price risk while waiting. The comparison above assumes a slow, steady savings pace. A fast one changes the math a lot.
You need to preserve cash reserves. Putting 20% down may reduce or eliminate PMI, but it also requires more cash upfront. If reaching 20% would leave you with little money for emergencies, closing costs, or other homeownership expenses, waiting or choosing a smaller down payment may need a closer look.
Section 07
Frequently Asked Questions
What if I’m already living rent-free while I save?
Then the $120,000 rent assumption in this example does not apply to you, which can make waiting more reasonable financially. The decision depends on your actual housing costs, savings timeline, and how home prices change while you wait.
Does this math still work if home prices are falling in my area?
Not necessarily. The additional down payment pressure in this comparison depends partly on how home prices change while you save. If your market is flat or declining, you may not face the same increase in the cash needed for a 20% down payment.
How does the comparison change if I can save the $45,000 gap in 2 years instead of 5?
The comparison changes significantly. Two years of rent at $2,000 a month is $48,000 instead of $120,000, and the potential increase in the down payment needed is smaller too, since prices have less time to rise. The key point is that a shorter saving period reduces the amount of rent you pay while waiting and limits the time during which home prices could change.
This is an illustrative estimate only, based on assumed rent and appreciation rates, and does not constitute an offer of credit or investment advice.
Section 08
Conclusion
PMI has a real cost, but it may be temporary depending on your loan and applicable requirements. Waiting can have costs too, including rent and potentially a higher future home price.
Talk with Duc Pham or the Wonder Rates team about how the numbers could look based on your down payment, current housing costs, savings timeline, and home-buying goals.
All figures, calculations, and examples in this article are for illustrative and educational purposes only. They do not constitute an offer of credit, financial advice, or investment advice. Rent, appreciation, PMI rates, and down payment requirements vary significantly by market, lender, and individual circumstances and are subject to change. Consult your loan officer for guidance specific to your situation.
Duc Pham, Mortgage Broker | NMLS# 844897 | 408-600-1900 | dp@wonderrates.com
Wonder Rates, Inc. | NMLS# 1518655 | DRE# 02047445 | DFPI# 60DBO-59134
Equal Housing Opportunity. Equal Housing Lender.
Licensed in: AL, AZ, CA, CO, FL, GA, LA, MI, NC, OH, OK, OR, PA, SC, TX, VA, WA